Data Visualization
Wherein I visualize data I find on the internet using web-based tools like D3.js, Leaflet.js, and CartoDB
3D Map of Manhattan

Date Created: 01-01-2017
Technologies: Mapzen, YAML, CSS
San Francisco Architecture Map
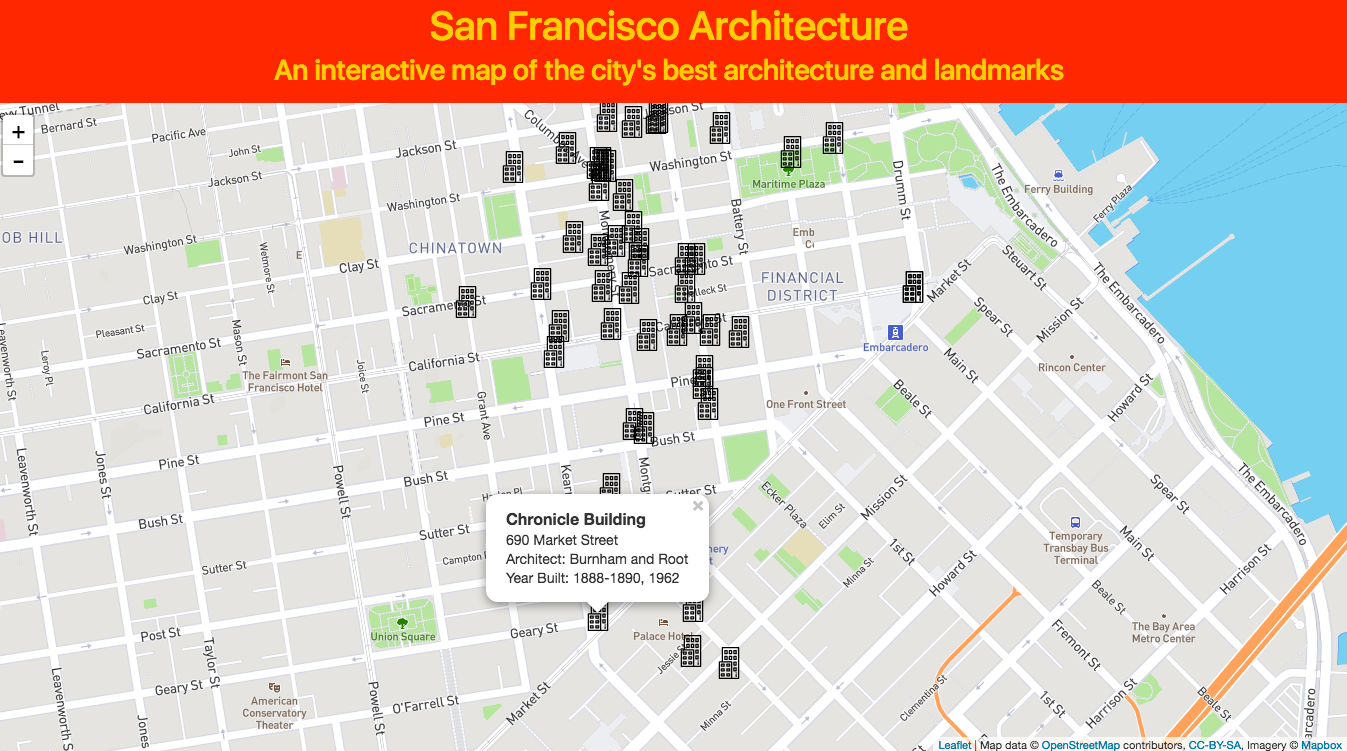
Date Created: Winter 2016
Technologies: D3.js, Leaflet.js, Mapbox, jQuery, Javascript, HTML, Bootstrap, GeoJSON
Temperature and CO2 Level Visualization

Date Created: 12/25/2016
Technologies: D3.js, Leaflet, FLotr2, jQuery, Javascript, HTML, CSS
San Francisco Street Names

Date Created: 12/25/2016
Technologies: D3.js, Leaflet, FLotr2, jQuery, Javascript, HTML, CSS
Constitutions
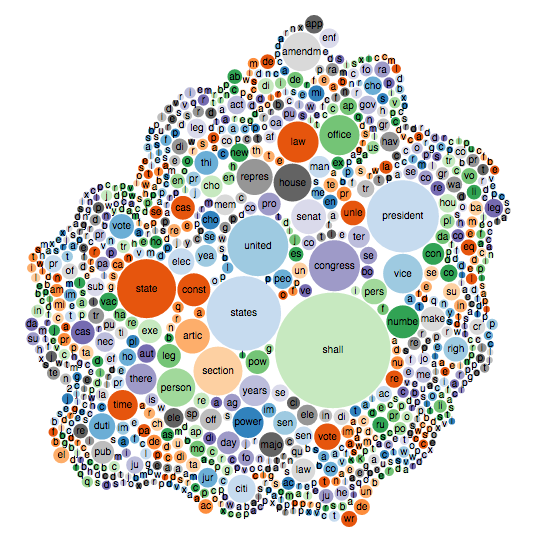
Date Created: Winter 2016
Technologies: D3.js, Alchemy API, jQuery, Javascript, HTML, CSS